Chart{+}Coders
If you are looking for top quality custom indicators for the ThinkorSwim platform written in ThinkScript, you have come to the right place. We have an incredible variety of indicators and systems for sale at excellent price points.
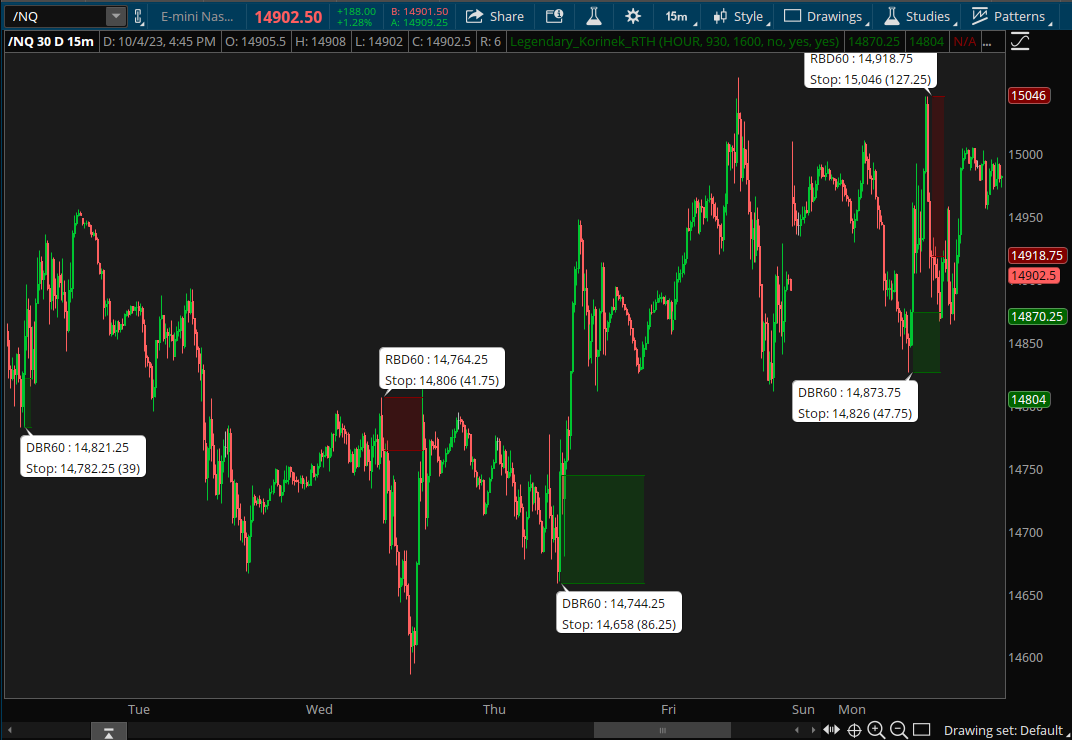
15 Minute Chart (Using 60 Minute Time Frame)
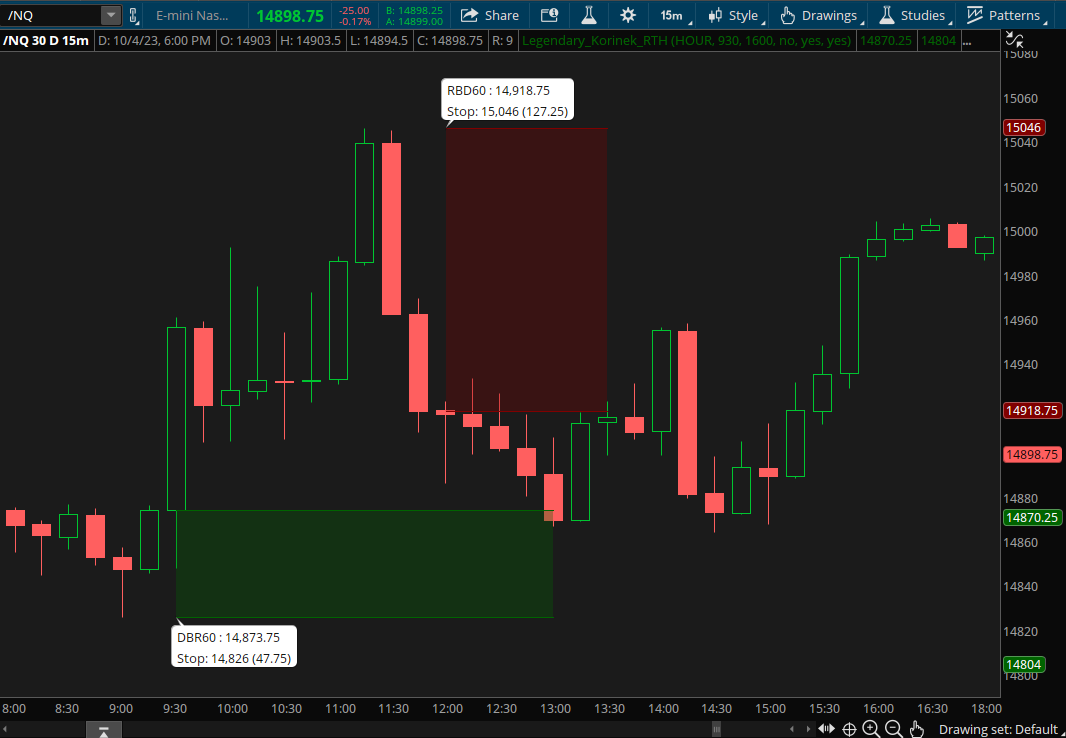
15 Minute Chart (Enhanced - Using 60 Minute Time Frame)
Rally Drop Indicator
Developed for The ThinkOrSwim Platform
[Alerts] - [Multi-Time Frame]
The Rally Drop Indicator consists of a few different components, so let's dive in a bit and see how it works. To begin, there are 4 different compnents as you can see below.
Begining with Rally Base Rally (RBR) it's definition is when you having a price pattern that indicates a continuation of the bullish trend, characterized by a strong rally followed by a consolidation period, and then another rally. This pattern suggests that buyers have taken over and should theoretically continue higher.
Rally base drop is a price pattern that indicates a potential reversal of the bullish trend, characterized by a strong rally followed by a consolidation period, and then a sharp drop. This pattern suggests that buyers have lost control of the market, and that sellers are taking over.
Drop base rally is a price pattern that indicates a potential reversal of the bearish trend, characterized by a sharp drop followed by a consolidation period, and then a strong rally. This pattern suggests that sellers have lost control of the market, and that buyers are taking over.
Drop base drop is a bearish continuation pattern, with a sharp drop followed by a consolidation period, and then another sharp drop. This pattern is thought of when sellers are still in control of the market, and that the price should theoretically continue moving lower.
The Indicator comes with alerts as well as multi-time frame capability so you can add another instance of the indicator with whichever time frame you wish to use. Just make sure that if you are using a 60 minute time frame for example that you understand that you cannot use anything lower than your current time frame. So for example you would not be able to use a 15 minute indicator while using a 60 minute chart, only higher than your current.
Request A Quote Or Drop Us A Question
Get in touch with us below so we can get you a lightning fast quote, or answer any questions you may have.